Block One
The Convergence Report
Which companies are converting AI investment into results, and whose clock is running out.
Capital becomes value along a chain: commitment, built infrastructure, enterprise adoption, business outcomes, competitive advantage. Each edition traces that chain with public evidence, sector by sector, and places every covered company on two exhibits: what the company has staked on AI against what its financials show, with a clock on every position marking time elapsed against the expected confirmation window.
Some companies show confirmation inside the window. Some clocks are still running. Some have run out without confirmation arriving. And the state worth the closest read, Unattributed Gains, holds companies whose ratios are improving while their AI narrative stays thin.
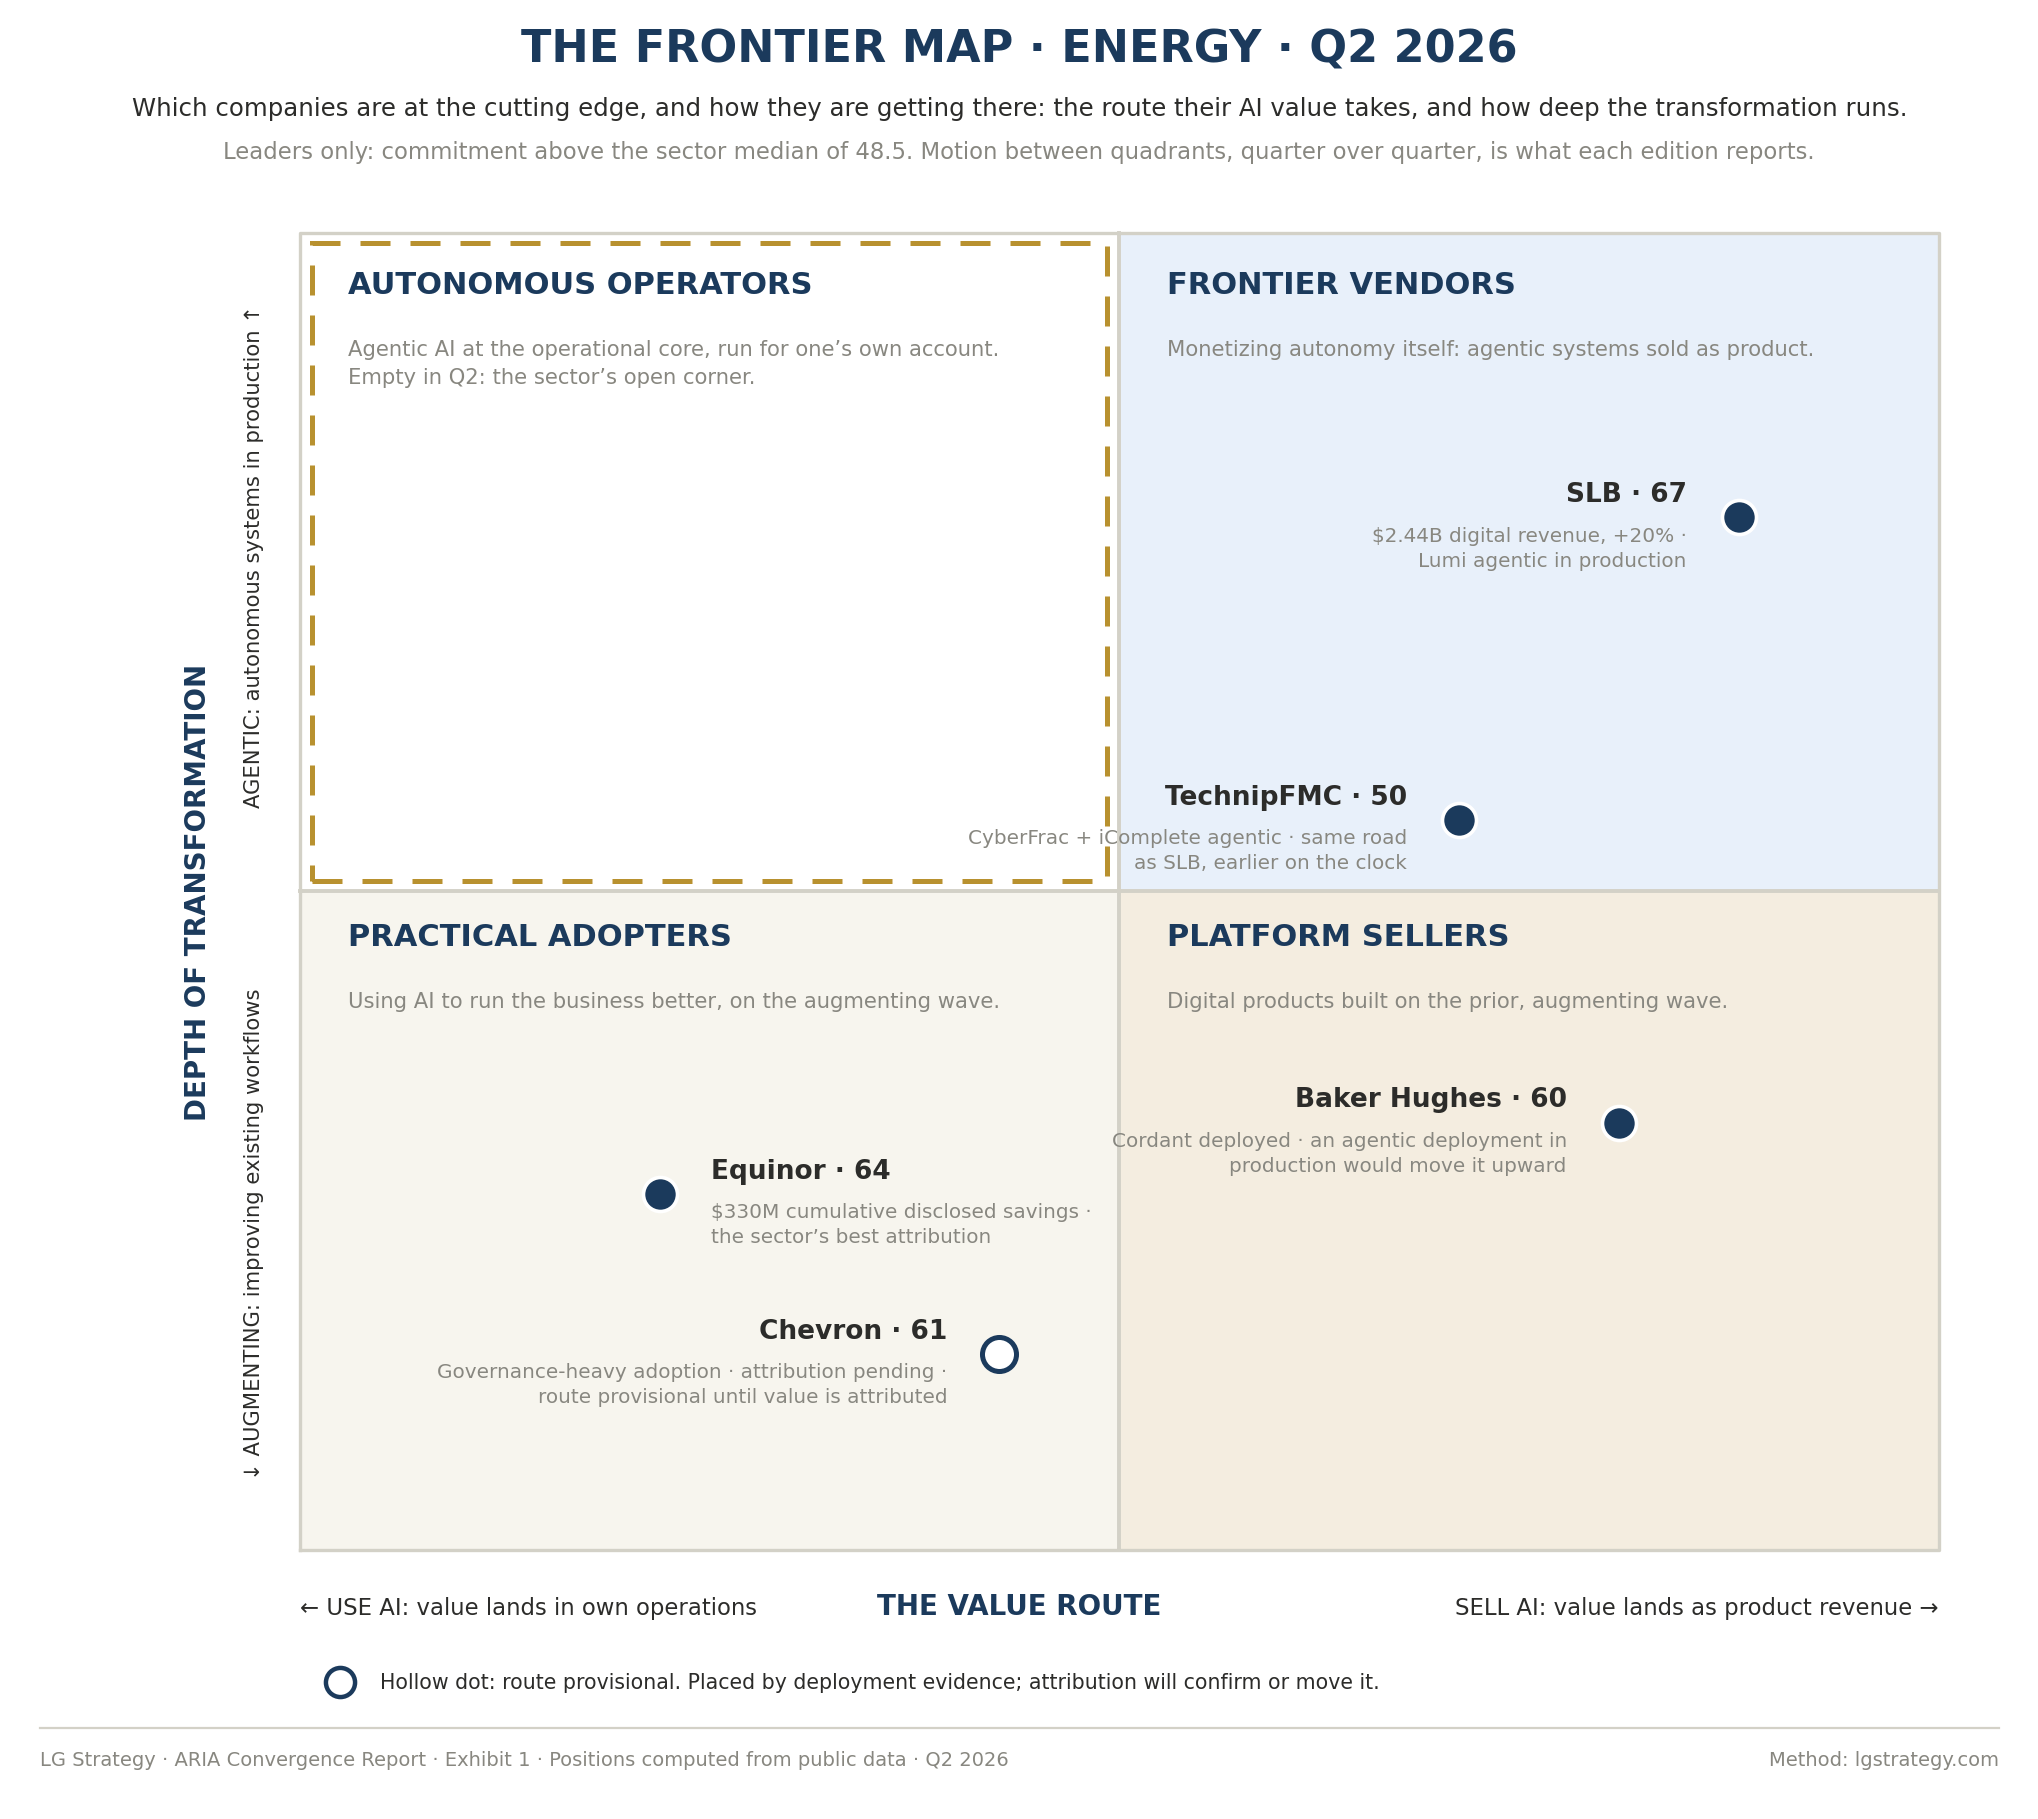
Exhibit 1 · The Frontier Map
The value route (Use AI to Sell AI) against depth of transformation (Augmenting to Agentic). Quadrants: Autonomous Operators, Frontier Vendors, Practical Adopters, Platform Sellers. Leaders only, above the sector commitment median. Hollow dots mark route-provisional placements, with attribution pending.
The value route (Use AI to Sell AI) against depth of transformation (Augmenting to Agentic). Quadrants: Autonomous Operators, Frontier Vendors, Practical Adopters, Platform Sellers. Leaders only, above the sector commitment median. Hollow dots mark route-provisional placements, with attribution pending.
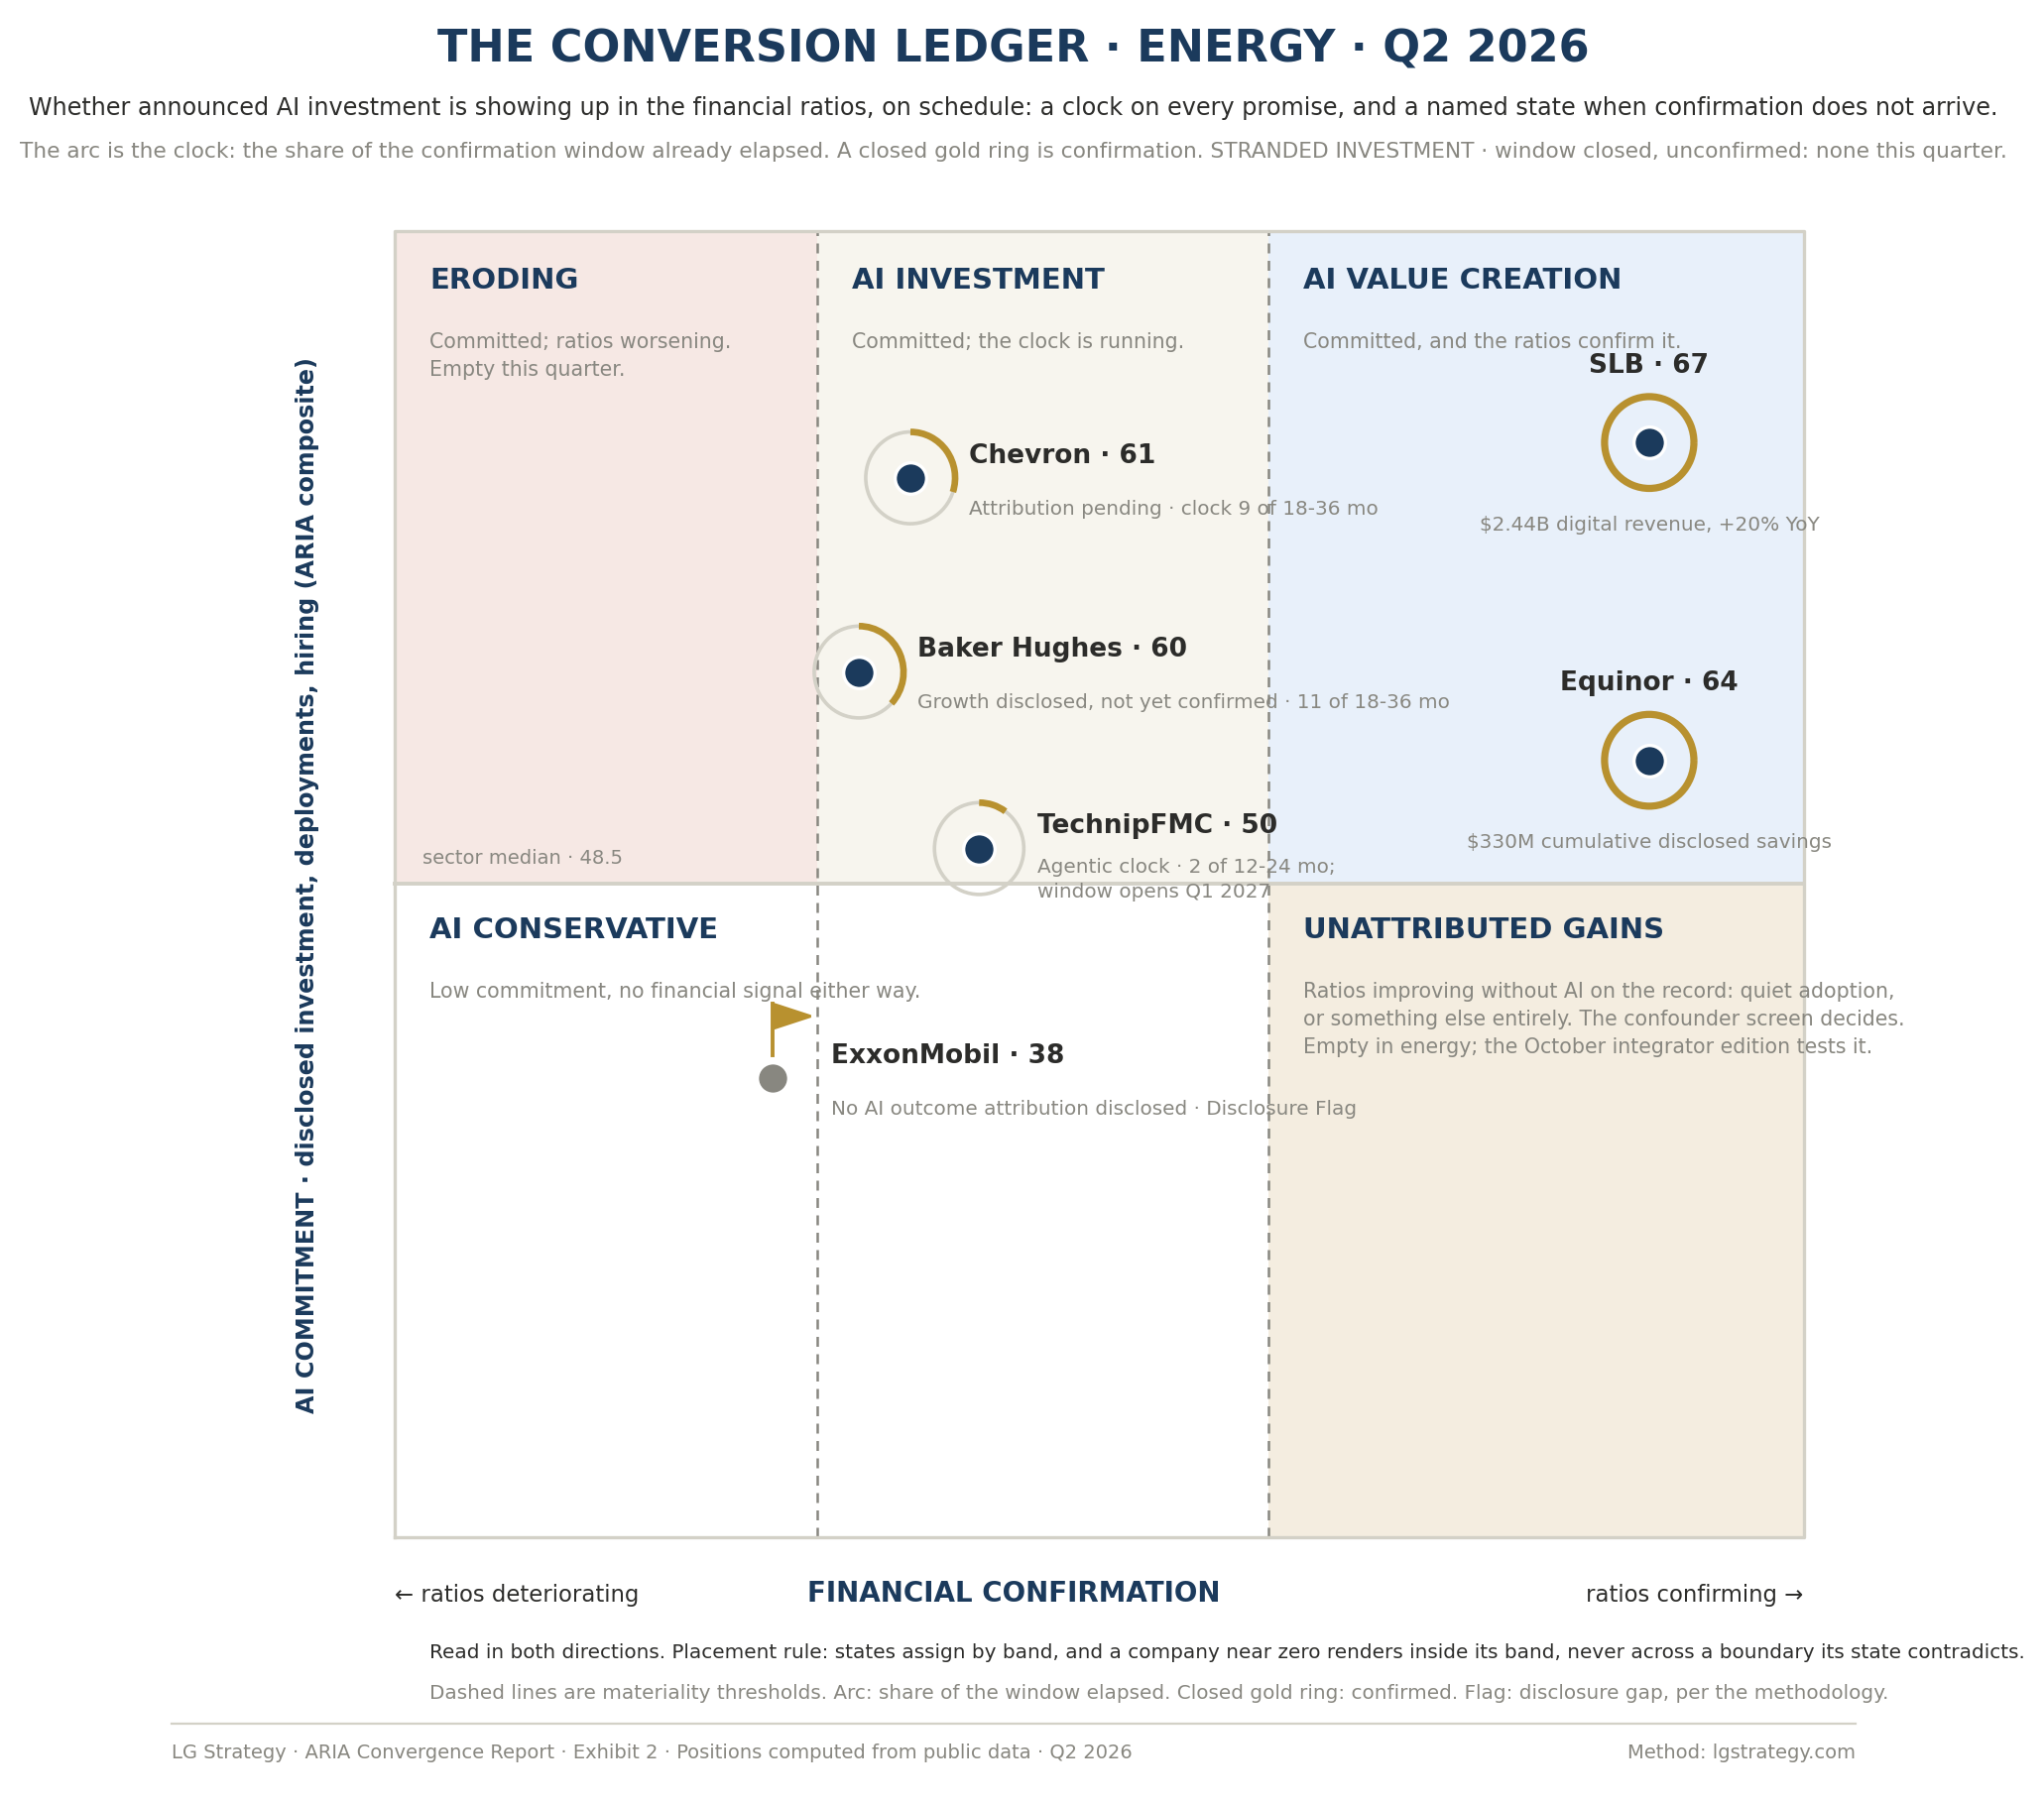
Exhibit 2 · The Conversion Ledger
AI commitment against financial confirmation, with band-based state assignment, a clock arc on every position, and a closed gold ring where confirmation has arrived. A company near zero renders inside its band, never across a boundary its state contradicts.
AI commitment against financial confirmation, with band-based state assignment, a clock arc on every position, and a closed gold ring where confirmation has arrived. A company near zero renders inside its band, never across a boundary its state contradicts.
AI Value Creation
AI Investment
Eroding
AI Conservative
Unattributed Gains
Stranded Investment
Edition One: Energy, Q2 2026. Sixteen public energy companies, scored from external data only.
Edition Two: the IT services integrators, October 2026. Eight firms whose own ratios test whether the transformation they sell produces the productivity they aspire to.
Edition Two: the IT services integrators, October 2026. Eight firms whose own ratios test whether the transformation they sell produces the productivity they aspire to.